> For the complete documentation index, see [llms.txt](https://en.docs.monaca.io/llms.txt). Markdown versions of documentation pages are available by appending `.md` to page URLs; this page is available as [Markdown](https://en.docs.monaca.io/products_guide/debugger/debug.md).
# Usage
On this page, we will describe how to use Monaca Debugger with Monaca Cloud IDE and Monaca local development tools Monaca Localkit and Monaca CLI.
{% hint style="info" %}
Before starting, please install Monaca Debugger on your device or emulator. Please refer to [How to Install Monaca Debugger](/products_guide/debugger/installation.md) for more information.
{% endhint %}
## Monaca Debugger with Monaca Cloud IDE
There are 2 main debugging functionalities that can be used to debug Monaca apps with the Monaca Cloud IDE:
* **Monaca Debug Panel**: DOM inspection and console debugging.
* **USB Debugging**: DOM inspection, console and JavaScript debugging.
### Monaca debug panel
A popular web debugging tool, [Weinre (WEb INspector REmote)](https://people.apache.org/~pmuellr/weinre/docs/latest/), is embedded in the debug panel of the Monaca Cloud IDE. This tool allows you to debug your app using console debugging and DOM inspection.

To start debugging your app by using Monaca Debugger with Monaca Cloud IDE, follow these instructions:
1. Open a project in the Monaca Cloud IDE.
2. Run the project in the Monaca Debugger.
3. Make sure your device is connected with the IDE. If your device appears in the debug panel, it is successfully connected to the IDE (see the screenshot below). Otherwise, please refresh the IDE or debugger until the connection is successfully made.

4\. After your device is connected to the IDE, you can start debugging your app.
#### Console debugging
Console API allows you to write and display messages to the console using Javascript.
Here are some commonly used commands to log text in the console:
* `console.log()`: displays a message to the console.
* `console.debug()`: displays a message on the debug level (you can see
the message in the debug tab).
* `console.warn()`: displays a message with a yellow warning icon.
{% hint style="info" %}
For more information about console API, please refer to [Console API references](https://developer.chrome.com/devtools/docs/console-api).
{% endhint %}
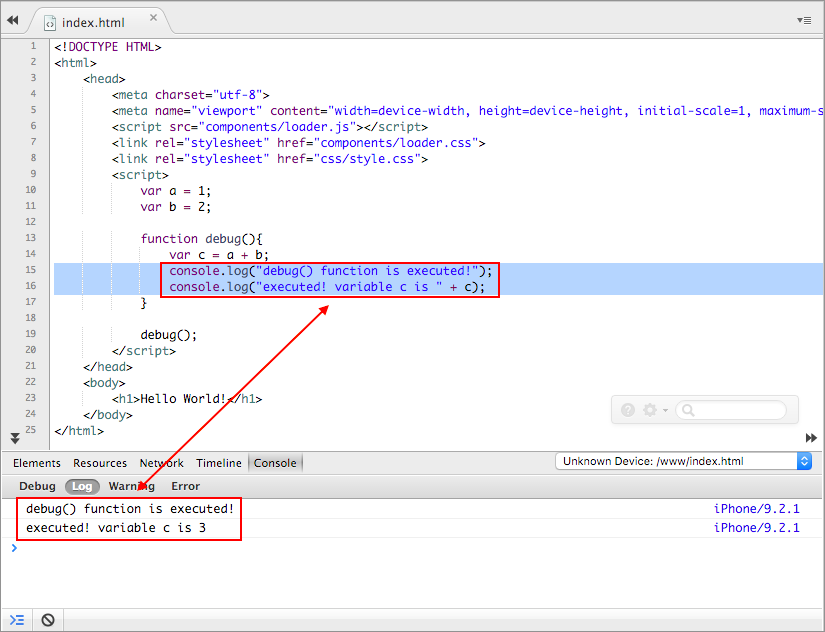
Here is an example of using the console API:
1. Copy and paste the following code to the `index.html` file.
```markup
Hello World!
```
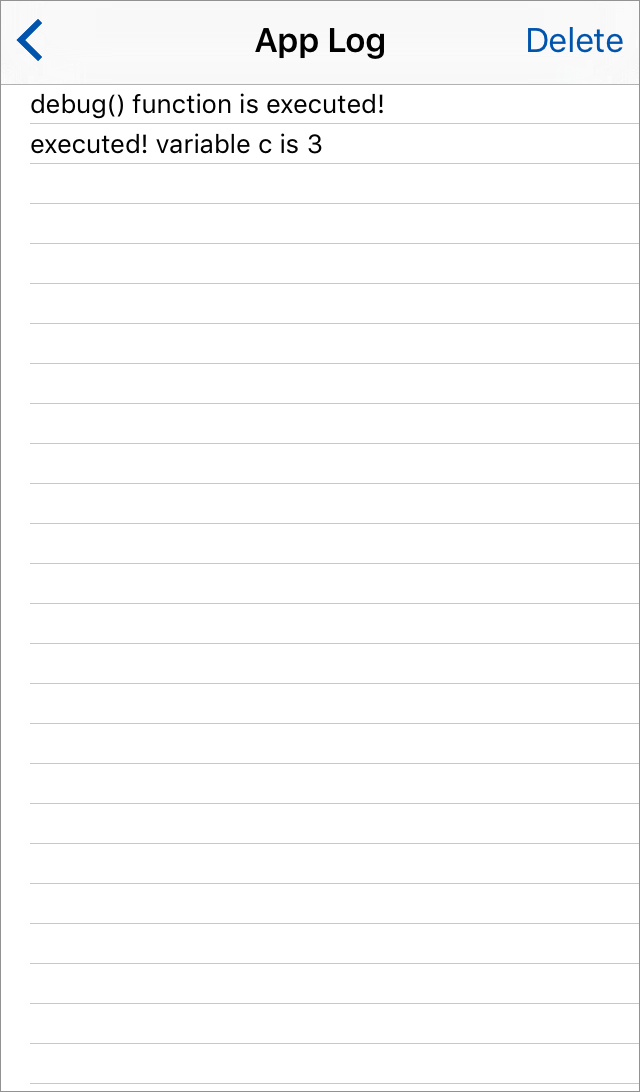
2\. Save the code and connect the Monaca Debugger with the Monaca Cloud IDE. Run the project in the Monaca Cloud IDE. Now you can see the messages on the debug panel in the Monaca Cloud IDE and in the app log inside the Monaca Debugger.
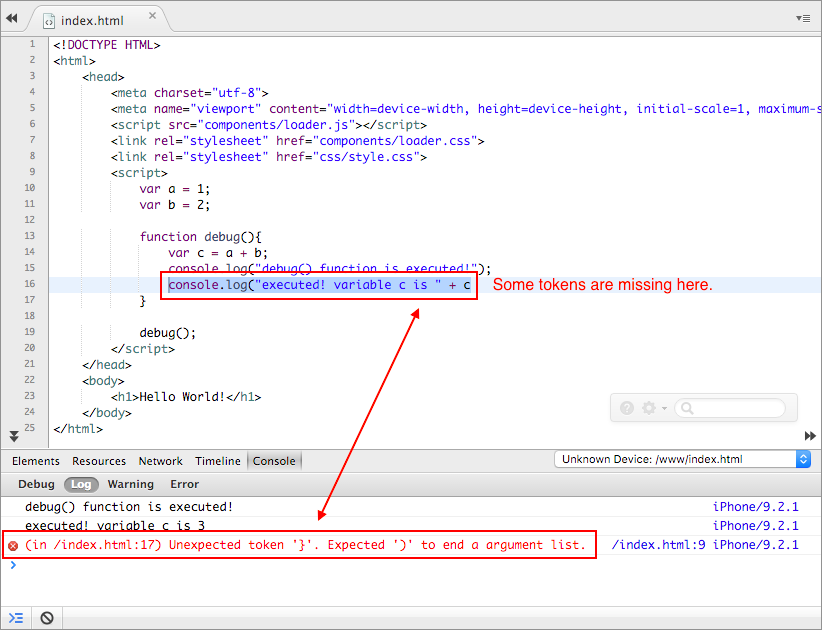
3\. The debug panel allows you to see the error log of your app as well.
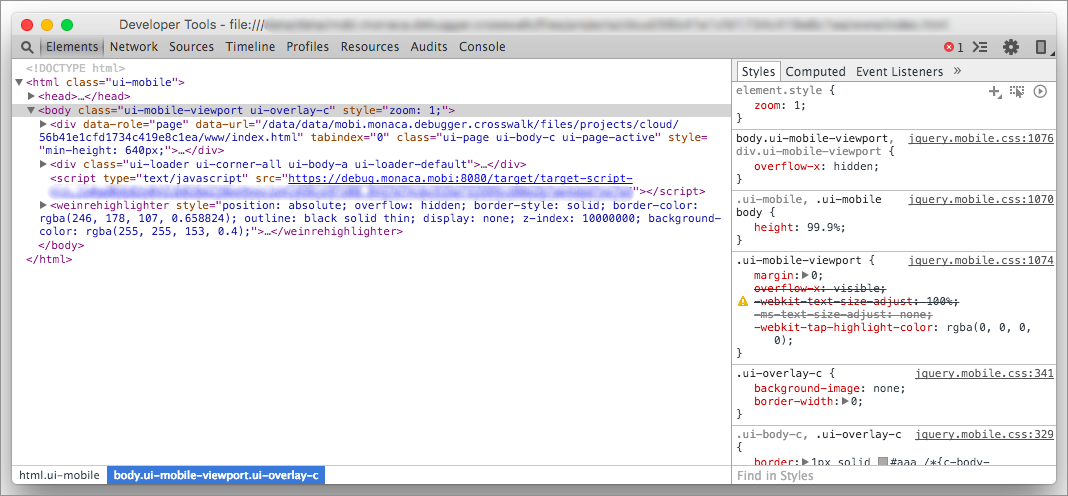
#### DOM inspection
DOM (Document Object Model) inspection allows you to:
* view the DOM structure of the currently active page.
* modify the DOM structure as well as the CSS of the page with live
update.
For more information, please refer to [DOM Inspection and Style Editing](https://developer.chrome.com/devtools/docs/dom-and-styles).

### USB debugging
With USB debugging, you can:
* **Console debugging**: use the console to display messages and set debugging
sessions.
* **DOM inspection**: view and modify DOM structures with live updates.
* **JavaScript debugging**: profile JavaScript performance, set
breakpoint and use the execution control.
There are two ways to implement USB debugging depending on what kind of device you use:
1. If you are using an iOS device, you can use the [Safari remote debugging](/products_guide/debugger/debug.md#safari-remote-debugging-for-ios-and-mac-only).
2. If you are using an Android device, you can use the [Chrome remote debugging](/products_guide/debugger/debug.md#chrome-remote-debugging-for-android-with-google-chrome-browser).
#### Prerequisites for USB debugging with Monaca
| Platform | iOS | Android |
| --------------------------- | ----------------------------------------------------------------------------------------------------------------------------------------------------------------------------------------------------------------------- | --------------------------------------------------------------------------------------------------------------------------------------------------------------------------------------------------------- |
| **Monaca Debugger** | [Custom built Monaca Debugger](/products_guide/debugger/installation/debugger_ios.md) only | Either store version or custom built [Monaca Debugger](/products_guide/debugger/installation/debugger_android.md) |
| **Install driver** | On Mac OS X, the necessary drivers should be already installed. The system will automatically find the device without any installation. | On Windows, you need to check the device manufacturer to find an appropriate driver for the device. |
| **Enabling USB debugging** |
Enable the web inspector on an iOS device:
Go to Settings ‣ Safari
Scroll down and select Advanced.
Switch on Web Inspector.
|
Enable USB debugging on an Android device:
Go to Settings ‣ More
Select Developer options.
Tick USB Debugging.
|
| **Trust connection** | The connected device should be displayed if you trust the host computer. Please trust the computer in order to get connected. | The connected device should be displayed if you trust the host computer. Please trust the computer in order to get connected. |
#### Safari remote debugging (for iOS and Mac only)
{% hint style="info" %}
You are required to do some setups before using USB debugging with Monaca. Please refer to [Prerequisites for USB debugging with Monaca](/products_guide/debugger/debug.md#prerequisites-for-usb-debugging-with-monaca).
{% endhint %}
1. Connect your iOS device to your Mac via a USB cable.
2. Run your Monaca project in its custom built debugger.
3. Open Safari app and go to the `Develop` menu. Your iOS device’s name should show in the list. You can see the available pages of the Monaca app from the submenu of the device. Select the one you want to open.

4\. The web inspector window will appear. In this window, you can for example use timing HTTP requests, profile JavaScript and manipulate the DOM tree. In order to learn how to use the web inspector, please refer to [Safari Web Inspector](https://developer.apple.com/library/ios/documentation/AppleApplications/Conceptual/Safari_Developer_Guide/Introduction/Introduction.html#//apple_ref/doc/uid/TP40007874).

#### Chrome remote debugging (for Android with Google Chrome browser)
{% hint style="info" %}
You are required to do some setups before using USB debugging with Monaca. Please refer to [Prerequisites for USB debugging with Monaca](/products_guide/debugger/debug.md#prerequisites-for-usb-debugging-with-monaca).
{% endhint %}
1. Connect your Android device to your PC via a USB cable.
2. Run your Monaca project in the Monaca Debugger.
3. In the Chrome address bar, enter `chrome://inspect/`.
4. The `Devices` page appears as shown below. Your connected Android device should show there. Click **inspect**.

5\. The Chrome inspection page should open. Now you can start debugging your Monaca app. For more information, please refer to [How to Use Chrome DevTools](https://developer.chrome.com/devtools).
See Also:
* [Functionalities](/products_guide/debugger/features.md)
* [Installation](/products_guide/debugger/installation.md)
* [Debugger Troubleshooting Guide](/products_guide/debugger/troubleshooting.md)